Make the Most Out of Genome Announcements with KBase
Genomics is a dynamic field driven by new technology, massive growth in data, and changes in how scientists share knowledge. This brings new challenges for researchers looking to maximize the impact of their science and ensure the longevity of their data. These changes are especially relevant for the practice of publishing genome announcements. Genome announcements are meant to share and promote newly sequenced organisms with the larger scientific community. A few decades ago, genome announcements were highly anticipated hallmarks of novel science. But, what was once a publishing coup is now an every day event. It is harder and harder to keep abreast of all the genomes that have been sequenced and promote your own new genomes to get the attention and recognition of your research community.
Fortunately, KBase can help construct genomes from your sequencing data, generate reports for your announcement, and promote your data to your research community.
Assembling Your Genome In KBase
There are several entry points into using KBase to support your genome announcement. The most common and essential starting point is quality control and de novo assembly of your sequencing reads.
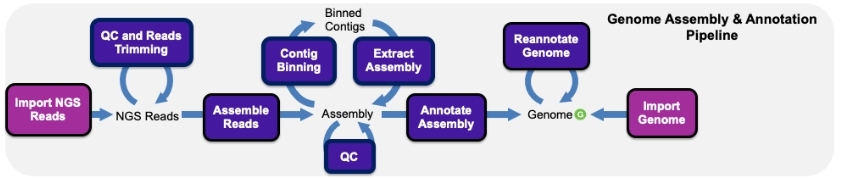
Assembly and Annotation Pipeline in KBase
You can begin by uploading your reads as a zipped or unzipped FASTQ file into your Narrative. Once your reads are on system, you can inspect the quality using tools like FastQC and CheckM. If you need to trim adaptors or remove low quality sequences, you can use Trimmomatic or Cutadapt, or use some of the other Read Processing tools in KBase.
KBase provides multiple apps for de novo assembly of Next-Generation Sequencing (NGS) reads from various sequencing platforms. Popular assemblers like Assemble Reads with SPAdes give you access to frequently used and reliable assembly methods for prokaryotic data, whereas high-performance and experimental tools like Assemble with Hipmer give you the power to assemble eukaryotic genomes. These assemblies can then be annotated with RAST or Prokka, enabling you to explore structural and functional features of a genome or use it in other analyses. If you already have an assembly constructed outside KBase, you can upload that as a FASTA file and then annotate your assembly.
Check out these resources for more details about strategy and methods for genome assembly and annotation on KBase:
- Tutorial – Assemble and Annotate Prokaryotic Genome
- Protocol – Using KBase to Assemble and Annotate Prokaryotic Genomes
Once you have assembled and annotated your draft genome, you can download it to your computer from the Data Panel in your Narrative. KBase enables you to download various file formats of any data you upload or generate on system. Check the file format requirement for the genome announcement publication you are submitting to make sure your genome is compatible.
Adding Value to Your Genome Announcement
Statistics
Every good genome announcement needs to report statistics about the genome. There are statistics for describing the read libraries, the assemblies, and the genomes. KBase’s apps provide these statistics at each step in the process of assembling and annotating your genome.
After reads libraries are imported into KBase, statistics on the number of reads, number of bases, percent GC, number of duplicates, quality score, and average read length are produced. These statistics could be included in a genome announcement, especially when comparing multiple read libraries or multiple genomes. Their uniformity or diversity may help generate the story for your publication.
After assembly, the QUAST report statistics include the final length, the number of contigs, N50, the number of Ns, the percent GC, and the largest contig. Include this information in a genome announcement, especially when comparing multiple assemblies or comparing your genome to published genomes. Assembly statistics are often presented in either a table or in the body of the text so that readers can immediately assess the quality of the reported assemblies.
Assemblies are annotated as genomes to provide statistics on the total number of genes, number of protein-coding genes, and average protein length, which are frequently cited statistics in genome announcements.
KBase can provide the statistics to genomes by size, number of contigs, percent GC, number of coding genes, etc. The summary table can be produced with the app Text Report – GenomeSet. The table can be put into a spreadsheet tool for incorporation into the paper.
Publication Figures
Figures are often used in genome announcements to describe the genome organization and any comparisons with other strains, or species. You can visualize the organization of your genome with the Circular Genome Visualization Tool. It shows the organization of the coding genes (CDS), the tRNAs, the rRNAs, percent GC, and the GC skew. The figure is downloadable directly from KBase and ready for submission with your manuscript.
Genome announcement may include a taxonomic tree as a way to place the genome in phylogenetic context. The taxonomic tree tools available in KBase include:
- Insert Genome into a Species Tree – phylogenetic approximation of species placement based on 40 COG-associated proteins and a database of representative genomes. Good for a rough estimate of where new genome(s) fall.
- View Tree – app for creating a publication quality figure from a tree, either generated by KBase or imported from elsewhere.
- Classify Taxonomy of Metagenomic Reads with GOTTCHA2 – written with metagenomes in mind, GOTTCHA2 creates both a dendrogram and Krona plot of how the reads were classified.
Comparative Analysis
It is common for a genome announcement to compare a new genome to published genomes or across a group of new genomes. This is important for understanding what matches to known features and what is unique. This can be part of the story of phenotype differences among strains or can be used to justify a unique niche for the study genome(s). Genomes can be compared on the basis of their statistics, their DNA, their proteome, or the genes in a specific family.
For comparison purposes, published genomes can be pulled from existing reference data in KBase, or uploaded as above, and run through the same annotation so all genomes are compared using the same process. This could be important if comparing old vs new genomes, or complete genomes vs genomes split across a number of contigs.
The degree of difference between genomic DNA from different samples can be compared with the FastANI app. This computes and compares an Average Nucleotide Identity as a measure of the nucleotide-level similarity in the coding region between two genomes. The output includes a table of the percent identities and PDF figures of the regions of similarity. Note: an ANI comparison has a finer level of resolution than a 16S genomic comparison because it uses the complete genome.
Tables of taxonomic comparisons can also be created with the apps:Genome announcement may include a taxonomic tree as a way to place the genome in phylogenetic context. The taxonomic tree tools available in KBase include:
- GTDB-tk classify – table with taxonomic classification for every assembly or genome included.
- Kraken2 Taxonomic Sequence Classifier – table of evidence for each level of taxonomic classification (beta).
Comparing proteomes can play an important role in comparing closely related strains and looking for differences. Proteomes can be compared in KBase using a dot-plot, pangenome, circle plot, domain annotation, functional profiles. These produce either tables or figures that can be used in the genome announcement. The apps include:
- Compare Two Proteomes – a dot-plot comparison for two proteomes
- Table output of pangenomes with Compute Pangenomes and Build Pangenome with OrthoMCL. The pangenome analysis can then be enhanced with Compare Genomes from Pangenome.
- A visualization of the pangenome can be created with Pangenome Circle Plot.
- The domains in the genomes can be annotated with Annotate Domains in a Genome. The presence/absence patterns and frequency of domains can then be visualized with the apps View Function Profile of a Genome and View Functional Profile of a Tree.
Some genomes are sequenced because they represent a unique phenotype or they expand the knowledge about a pathway or function in different environments. Comparing and contrasting a family of genes can create a picture of its diversity. KBase has numerous ways to analyze genes in a specific family. Genes (or features), can be compared with MUSCLE, BLAST, analyze for CAZy domains (beta) and View Function Profile of a FeatureSet. A Multiple Sequence Alignment (MSA) from MUSCLE can be further analyzed with GBLOCKS and with FastTree2
Journal Submission
KBase can assist with paper preparation by doing a publication search for a protein sequence (Paper BLAST). PaperBLAST is software that finds open access publications related to a gene of interest, based on protein sequence similarity between your gene of interest and a gene described in the publication.
KBase can support submissions to journals by providing citable static links to Narratives (see more in the next section). These links can be used in the paper as background information on how the analysis was done, as a source of the data, and a workflow of the entire process, enabling your data to be findable, accessible, interoperable, and reusable (FAIR). Anyone can then copy your Narrative and reproduce your analysis on their own data, making data sets also comparable, or can test alternative ways to analyze these data.
Examples of journals that currently accept genome announcements for publication.
Microbiology Resource Announcements: Limit of 500 words exclusive of the abstract and acknowledgments. Online-only, open access journal publishing articles on the availability of microbiological resources.
Genome Biology and Evolution: Focused 2500-word papers describe substantial enhancement of genome resources for a species or clade.
Journal of Genomics: A 1000-word report describing novel data sets from high-throughput analysis of genotypes, phenotypes, gene expression, metabolomes, proteomes or genome assemblies.Standard metrics for data quality and the experimental design must be clearly reported.
3biotech: Springer, Short genome report (∼500-word) on newly sequenced genomes and metagenomes. Open access options available.
Promoting Your Genome Announcement with KBase
One of the most powerful ways KBase can amplify your genome announcement is by sharing your genome and associated reports in a public Narrative. This allows other KBase users to view your genome and workflow, or download these data and data products to their computer. Public Narratives serve as resources for the user community by capturing valuable data sets, reproducible analyses, and scientific context describing the rationale behind a genome announcement. For example, see how Gupta et. al. (2019) link to different sections of their Narrative throughout their genome announcement, directing readers to each tool and report listed in the publication:
Gupta N, Skinner KA, Summers ZM, Edirisinghe JN, Faria JP, Marshall CW, et al. Draft Genome Sequence of Rhodococcus sp. Strain ATCC 49988, a Quinoline-Degrading Bacterium. Microbiology Resource Announcements. 2019
Our newly released static Narratives feature takes public Narratives beyond the KBase user community. With static Narratives, you can take a snapshot of your public Narratives and share them outside KBase. Anyone can view a static Narrative and see all data, apps, citations, and other content inside, even without a KBase account. To create a static Narrative, click the Share button in your public Narratives and go to Manage Static Narratives where you can create and manage existing static Narratives.